
Carlinville, Illinois Test Score Study
Overview
Dr. Christopher Shaw, a researcher from Carlinville, Ill., recently completed a study that shows that children who play bridge perform better on standardized tests than their non-bridge playing counterparts. The study utilized the The Iowa Test of Basic Skill (ITBS) which has five separate subject areas scored separately. This test structure and scoring scale allowed a comparison of the performance of five non-bridge groups of students to one test group of bridge playing students on all five subjects. The database tracked the scores over three years to see how much gain the two groups made.
The standardized testing schedule in the Carlinville schools has the kids taking the ITBS in September of 5th grade, April of 6th grade and April of 7th grade. Thus, the entire 5th grade in 2001-02 was tested before the bridge playing group learned how to play bridge. They were all tested 20 months later as 6th graders and again 32 months later as 7th graders. The standardized testing program used the same scoring scale for all three tests.
Initial Study Results
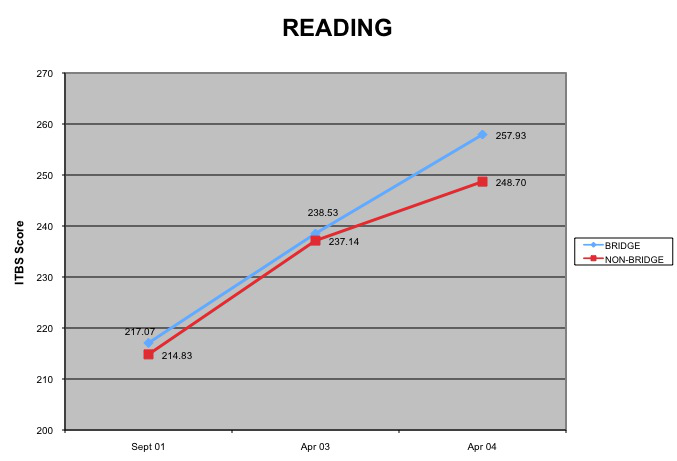
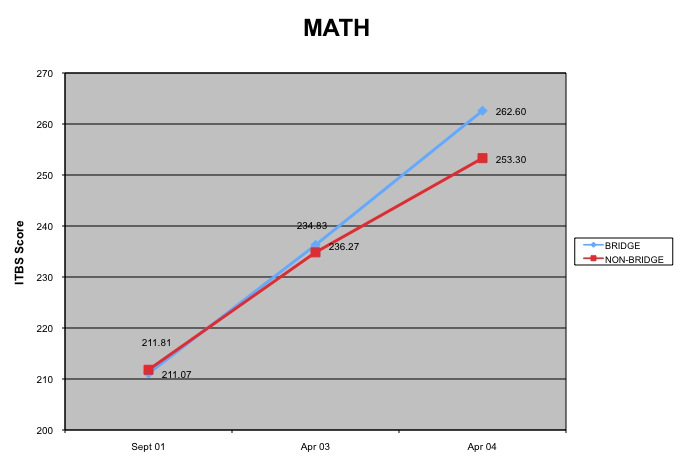
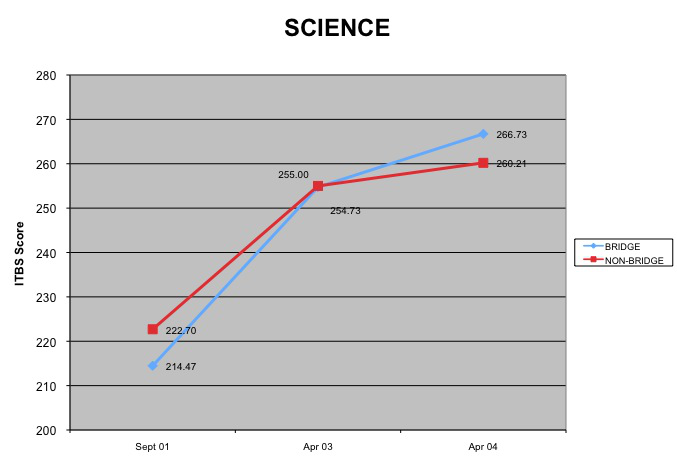
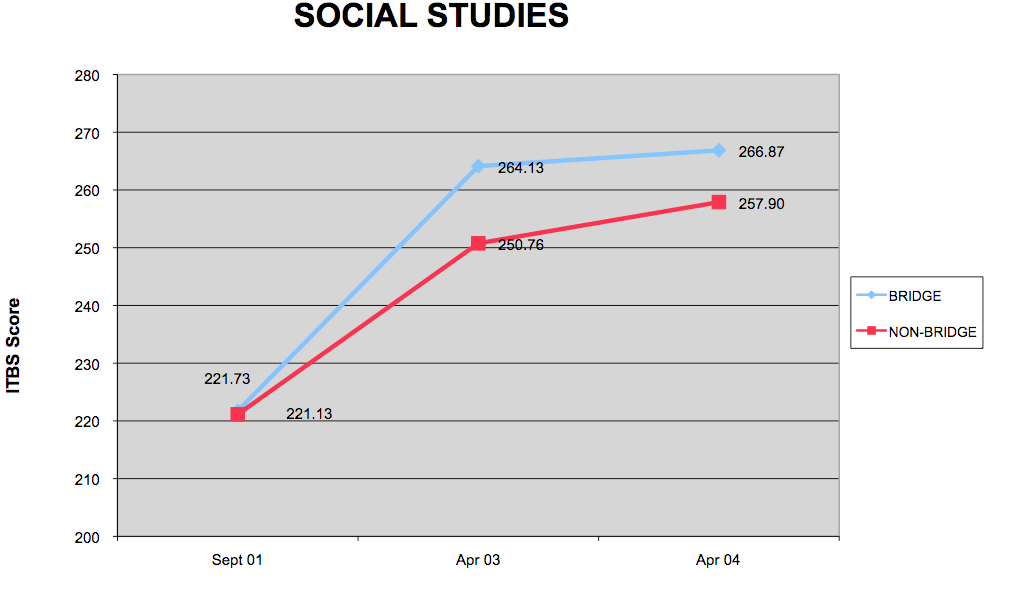
As you can see from the following graphs, the bridge-playing students in the initial study not only showed greater improvement after 20 months but also increased that advantage over the next 12 months.

Followup
Subsequently, Shaw expanded his study to three sequential classes of fifth graders (2001–2003) taught by the same instructor. The 2001 group was taught bridge, but the 2002 group was not. The 2003 group was also taught the game.
Shaw examined each group’s results on the ITSB over a three–year period. The first two tests were given 20 months apart; 32 months elapsed between the first and last test. Shaw compared the results in these tables:
20-Month Average Test Score Gains
| Reading | Math | Social Studies | Language | Science | |
|---|---|---|---|---|---|
| 2001 (Bridge) | 21.47 | 25.20 | 21.99 | 18.03 | 40.27 |
| 2002 (Non-bridge) | 17.43 | 24.26 | 14.31 | 30.52 | 29.79 |
| 2003 (Bridge | 28.50 | 34.95 | 24.17 | 21.11 | 24.67 |
32-Month Average Test Score Gains
| Reading | Math | Social Studies | Language | Science | |
|---|---|---|---|---|---|
| 2001 (Bridge) | 40.87 | 51.53 | 30.49 | 22.72 | 52.57 |
| 2002 (Non-bridge) | 23.37 | 36.42 | 25.15 | 30.05 | 36.05 |
| 2003 (Bridge | 39.72 | 45.67 | 32.50 | 37.17 | 45.11 |
The 2001 bridge students had higher test scores than the 2002 students at the end of 20 months and 32 months in four of the five subject areas. The language gain was less than the 2002 non-bridge students.
The 2003 bridge students out-gained the 2002 class in four of the five subject areas after 20 months (science scores were lower than the 2002 group), but exceeded the 2002 group in all areas after 32 months.